Statistics (Handling Data)
Tally charts, pictograms and bar charts to represent results are all part of Year 3 Statistics.
In Year 3 pupils should be taught to:
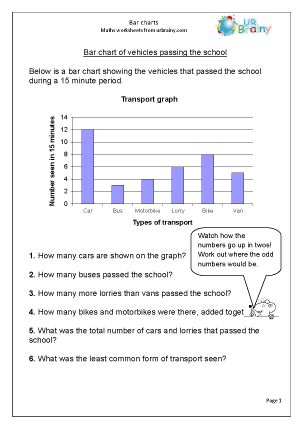
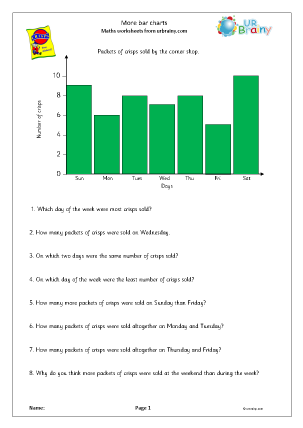
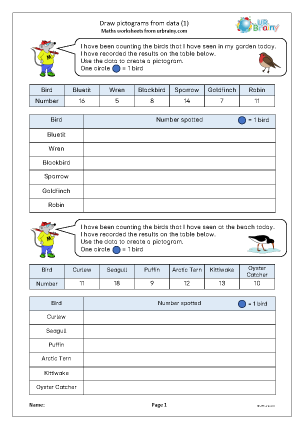
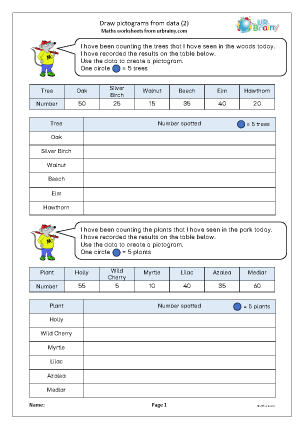
interpret and present data using bar charts, pictograms and tables
solve one-step and two-step questions such as ‘How many more?’ and ‘How many fewer?’ using information presented in scaled bar charts and pictograms and tables.







Tables
Finding information from tables, including 2-way tables.


Subscribe to our newsletter
The latest news, articles, and resources, sent to your inbox weekly.


© Copyright 2011 - 2026 Route One Network Ltd. - URBrainy.com 14.0.35