Statistics (Handling Data) for Year 5 (age 9-10)
Complete and use graphs to solve problems, including line graphs.
We have a great selection of worksheets for Statistics in the Year 5 Programme of Study, including plenty of line graphs.
The statutory requirements state that pupils should be taught to:
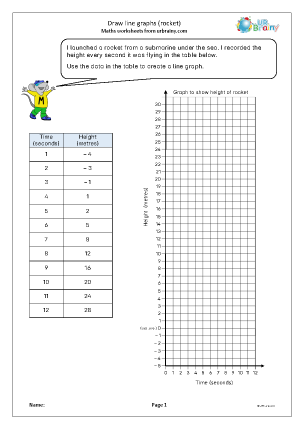
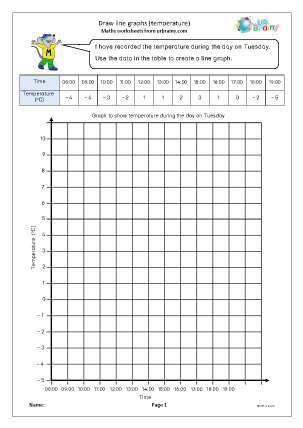
solve comparison, sum and difference problems using information presented in a line graph
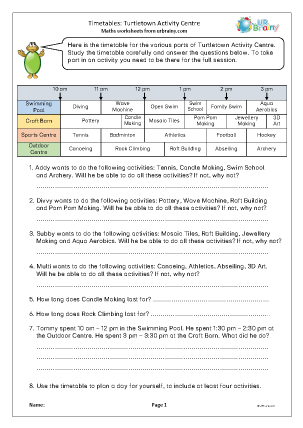
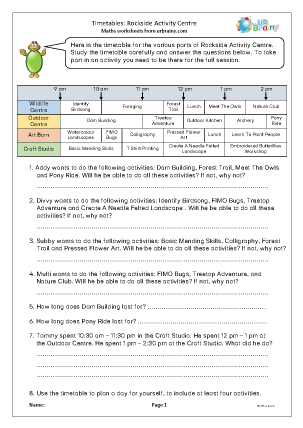
complete, read and interpret information in tables, including timetables.
Reading tables and interpreting graphs
Reading tables and charts and interpreting bar graphs.


Line graphs
Interpreting and using line graphs.


Further data handling
Further work on data handling including probability.