Statistics (Handling Data) in Year 6
Problems will be solved by collecting data, sorting, presenting and interpreting it. Grouped discrete data and line graphs are introduced.
Revising Graphs
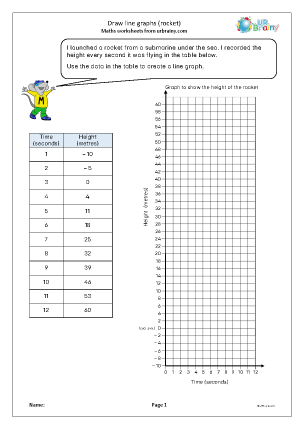
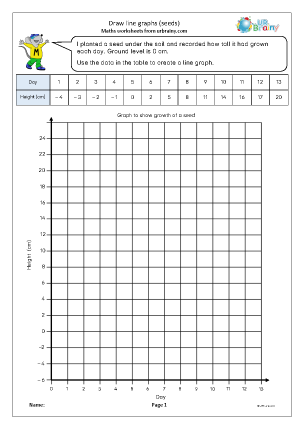
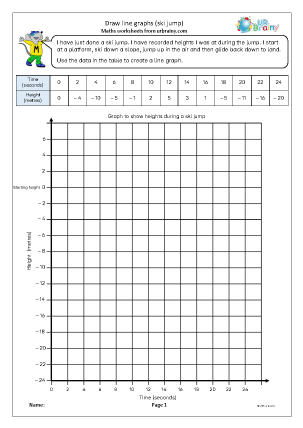
More work on a variety of graphs, especially line graphs.




Pie Charts
Interpreting and drawing pie charts.


Mean, Median and Mode
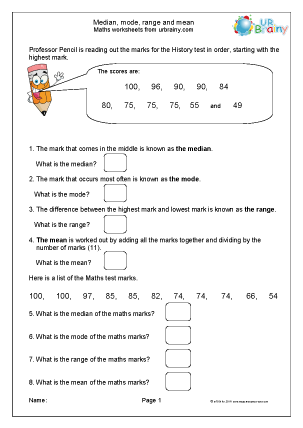
Finding the mean, median, mode and range of a set of data.


Probability
After SATs why not some fun with probability?


Subscribe to our newsletter
The latest news, articles, and resources, sent to your inbox weekly.


© Copyright 2011 - 2026 Route One Network Ltd. - URBrainy.com 14.0.35