Statistics (Handling Data)
Pictograms, tally charts, block diagrams and simple tables are all covered by our detailed collection of resources.
Collecting, recording and sorting data becomes more sophisticated in Year 2. The statutory requirements for Year 2 state that:
pupils should be taught to:
• interpret and construct simple pictograms, tally charts, block diagrams and simple tables
• ask and answer simple questions by counting the number of objects in each category and sorting the categories by quantity
• ask and answer questions about totalling and comparing categorical data.
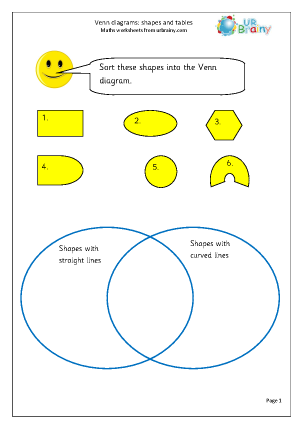
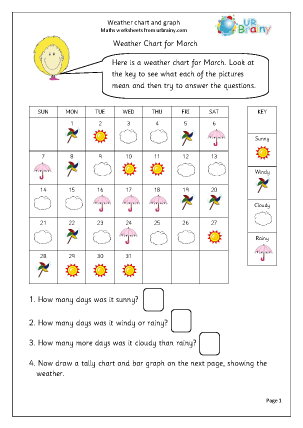
We have a really great collection of worksheets on pictograms, tally charts, block graphs and bar charts. Venn and Carroll diagrams are also used, and results of surveys are shown as block graphs and pictograms. It is important that children have the opportunity to ask and answer questions about data.
We also have kept our Year 1 Statistics worksheets as we feel it is important that children get an early insight into handling data.
Sorting information



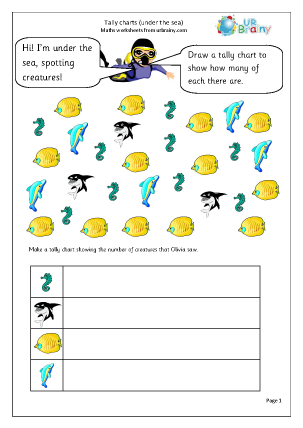
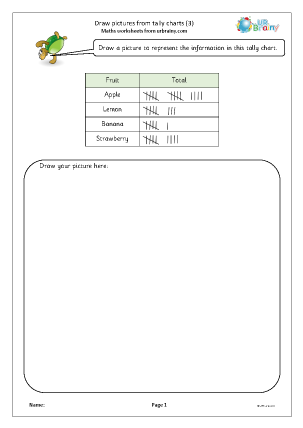
Tally charts
Resources to help with interpreting and creating simple tally charts.



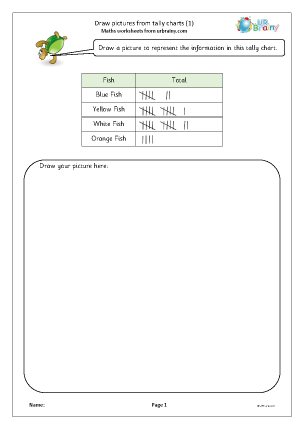
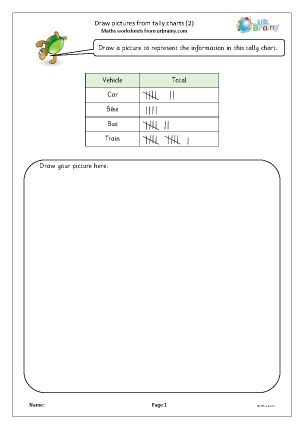
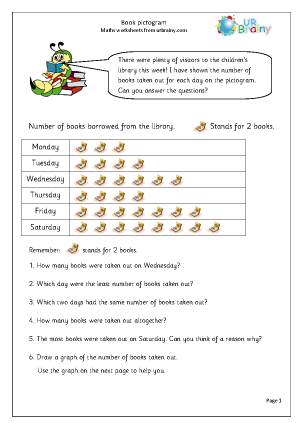
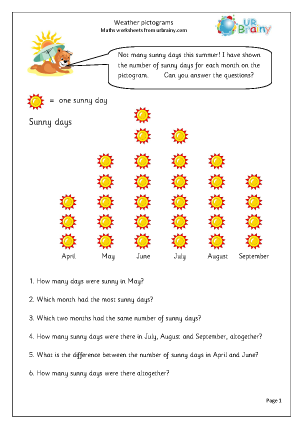
Pictograms
Bright and colour pages to help with interpreting and drawing pictograms.




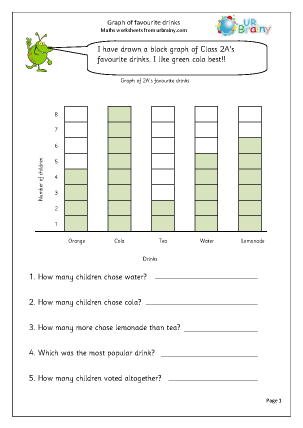
Block diagrams
Great ideas for interpreting and drawing block diagrams.





Subscribe to our newsletter
The latest news, articles, and resources, sent to your inbox weekly.


© Copyright 2011 - 2026 Route One Network Ltd. - URBrainy.com 14.0.38