A selection of our very best maths resources entirely free, updated each month.
Available for everyone, even expired accounts.
Autumn
Spring
Summer
Answer the questions using the place value chart with numbers in the millions.
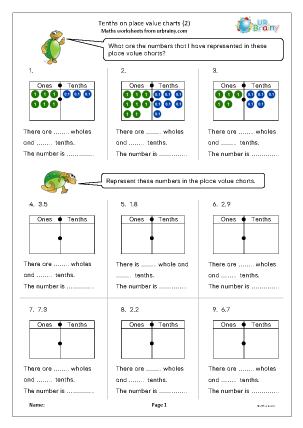
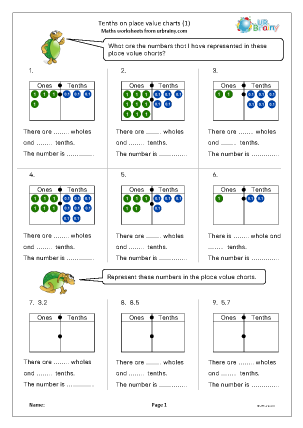
Representing decimals on a place value chart.
Week 19 worksheets on using kilograms, recording information in a table and collecting and organising data as a tally chart.
Year 1 maths worksheets on understanding and using Venn and Carroll diagrams, collecting and organising data as a tally chart, interpreting and collecting data for a pictogram and much more.
More on tally charts and presenting the information as a graph.
Interpret pictograms, tally charts and tables.
Using tally charts and interpreting data.
Tally charts and bar charts with the theme of food.
Tally charts and bar charts with the theme of vehicles.
Tally charts and bar charts with the theme of zoo animals.
Colour the chart with the correct number of shapes shown.
Showing 13 to 24 of 46 results
The latest news, articles, and resources, sent to your inbox weekly.
© Copyright 2011 - 2026 Route One Network Ltd. - URBrainy.com 13.5.9