Statistics (Handling Data) Maths Worksheets for Year 1 (age 5-6)
Statistics is not included in the new Maths Programme of Study but we believe that children should gain an introduction to it as there is more data in the world now than at any other time! In Year 1, we concentrate on collecting and sorting information in lists and tables, including making tally charts. The results can be presented in the form of a block graph. Diagrams such as Venn and Carroll will be introduced to sort objects into groups.
Sorting information
Collecting and sorting information including using tally charts.


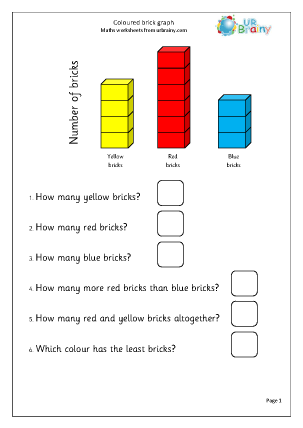
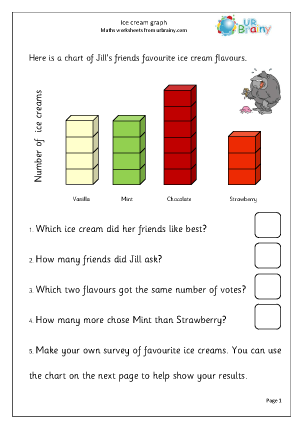
Graphs
Interpreting block graphs and beginning to make simple graphs.


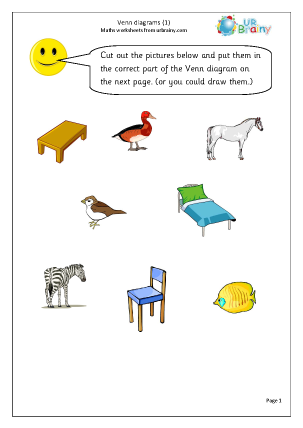
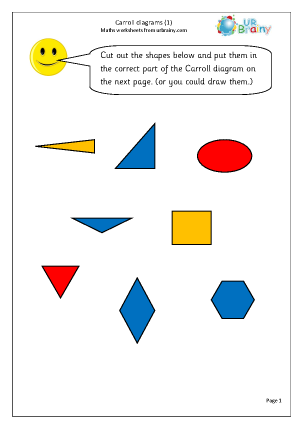
Venn and Carroll diagrams
An introduction to sorting information using Venn and Carroll diagrams.