Statistics (Handling Data) in Year 4
Use appropriate graphical methods.
In Year 4 pupils should be taught to:
interpret and present discrete and continuous data using appropriate graphical methods, including bar charts and time graphs
solve comparison, sum and difference problems using information presented in bar charts, pictograms, tables and other graphs.
Interpreting charts and tables
Finding information from charts and tables.


Interpreting Pictograms and Graphs
Interpret and present data including pictograms and bar charts.


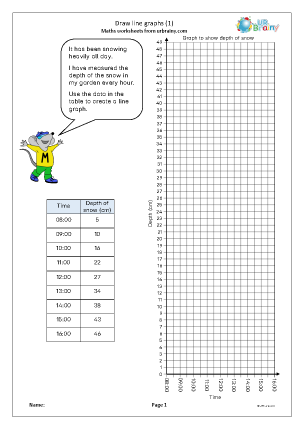
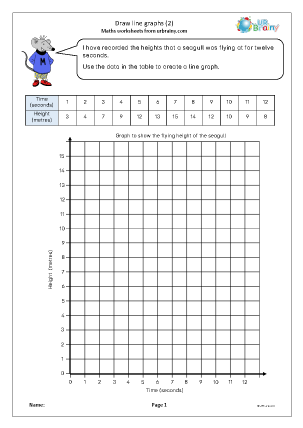
Line Graphs
Begin to use and interpret line graphs.