A selection of our very best maths resources entirely free, updated each month.
Available for everyone, even expired accounts.
Autumn
Spring
Summer
Support material for Year 3 Maths Mastery Summer Term Block 5: Statistics
Pictograms are a common way of organising and displaying data. Usually the images represent more than one item, making them harder to interpret.
Complete pictograms from given information.
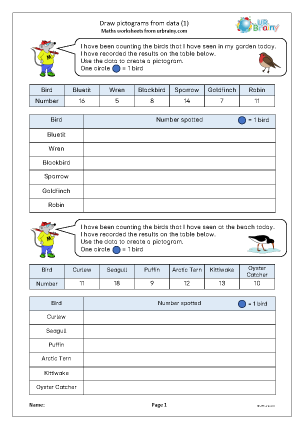
Use the data to create a pictogram.
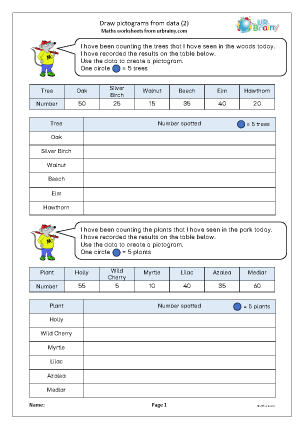
Use the data to create pictograms.
Using data shown on pictograms to make block graphs.
Using the information from a pictogram to make a block graph, all with a gardening theme.
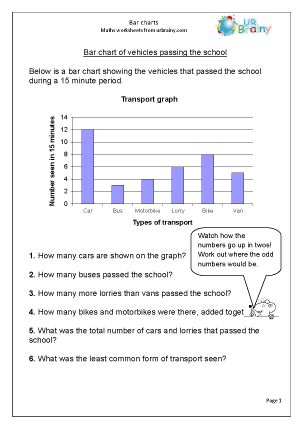
Introducing bar charts as a way of displaying information, with questions about the data shown.
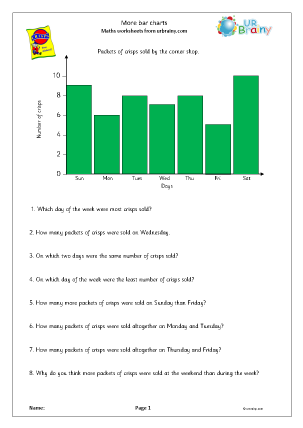
A further look at interpreting bar charts.
Interpreting a graph and suggestions on collecting data and producing a similar graph on favourite zoo animals.
Interpreting graphs on type of car and birds.
Use tally charts to collect and represent data.
A look at 2-way tables.
Complete two-way tables from data provided.
Interpreting tables.
More interpreting tables, including money.
The latest news, articles, and resources, sent to your inbox weekly.

© Copyright 2011 - 2026 Route One Network Ltd. - URBrainy.com 14.0.21