A selection of our very best maths resources entirely free, updated each month.
Available for everyone, even expired accounts.
Autumn
Spring
Summer
Support material for Year 2 Maths Mastery Summer Term Block 3: Statistics
Make and interpret a tally chart on farm animals.
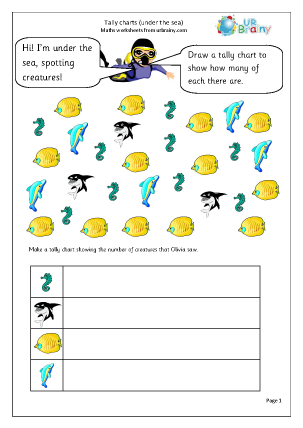
Draw a tally chart of the number of fish spotted. Use the data to complete a bar graph.
Further work on tally charts and bar graphs.
Tally charts and bar charts with the theme of food.
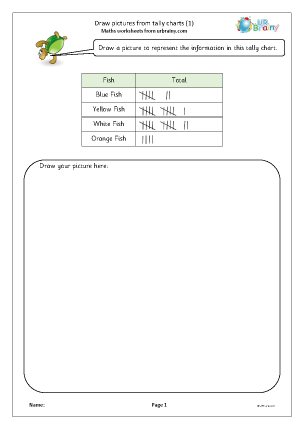
Draw pictures to represent the information on the tally charts.
Drawing block diagrams from given data.
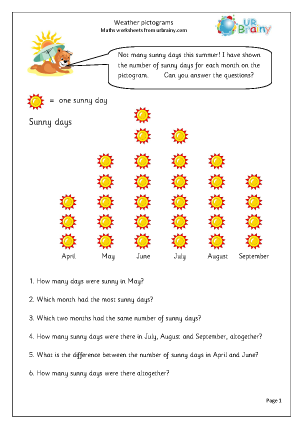
Not very sunny last summer, according to this pictogram!
Who goes to bed too late? Survey time.
Draw pictograms from information provided in tally charts.
Interpret pictograms.
Graph of children's favourite sandwich fillings
Sorting children who can ride a bike or swim using a Carroll diagram.
Great idea for collecting data which can then be used to make lists and show results as a graph.
The latest news, articles, and resources, sent to your inbox weekly.

© Copyright 2011 - 2026 Route One Network Ltd. - URBrainy.com 14.0.17