A selection of our very best maths resources entirely free, updated each month.
Available for everyone, even expired accounts.
Autumn
Spring
Summer
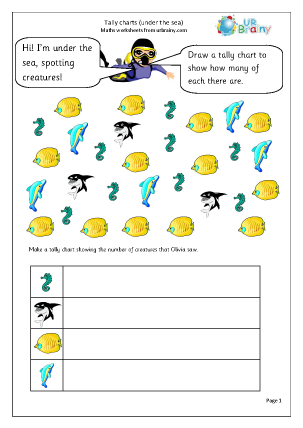
Draw a tally chart of the number of fish spotted. Use the data to complete a bar graph.
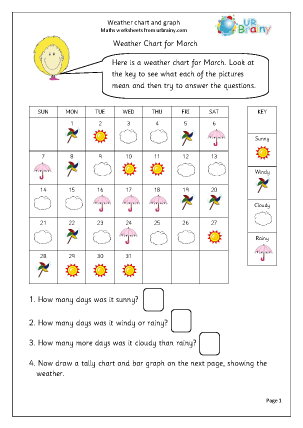
Was it wet in March? Interpret a weather chart for the month of March and draw a bar graph showing the results.
Square graph paper with 1 mm squares in blue. Be sure to print at 100% scale.
Square graph paper with 1 mm squares in black and white. Be sure to print at 100% scale.
Square graph paper with 2 mm squares in black and white. Be sure to print at 100% scale.
Square graph paper with 2 mm squares in blue. Be sure to print at 100% scale.
Week 18 worksheets on measuring length using metres, listing and sorting information, interpreting and drawing block graphs and measuring capacity.
Year 1 maths resources on using Venn diagrams, using Carroll diagrams, measuring objects, interpreting and drawing block graphs and much more.
Resources for Year 2 Block B Unit 1 Week 1
Resources for Year 2 Block B Unit 1 Week 3
Resources for Year 2, Block C, Unit 1
Complete the graph of shapes.
Showing 13 to 24 of 41 results
The latest news, articles, and resources, sent to your inbox weekly.
© Copyright 2011 - 2026 Route One Network Ltd. - URBrainy.com 13.5.12