Statistics (Handling Data)
Pictograms, tally charts, block diagrams and simple tables are all covered in Year 2.
Statistics is the latest term for what was called Handling Data. This no longer appears at all in the Year 1 curriculum, but is introduced in Year 2.
The new statutory requirements for Year 2 state that:
pupils should be taught to:
interpret and construct simple pictograms, tally charts, block diagrams and simple tables
ask and answer simple questions by counting the number of objects in each category and sorting the categories by quantity
ask and answer questions about totalling and comparing categorical data.
We have a really great collection of worksheets on pictograms, tally charts, block graphs and bar charts so why not take a dip now? We also have kept our Year 1 Statistics worksheets as we feel it is important that children get an early insight into handling data.
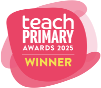
Sorting information
Sorting information into categories, including simple Venn and Carroll diagrams.


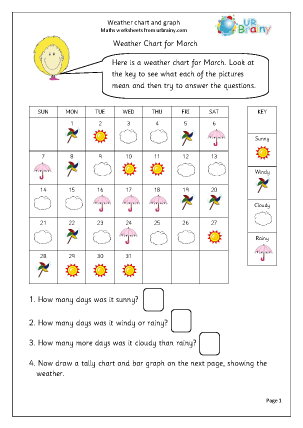
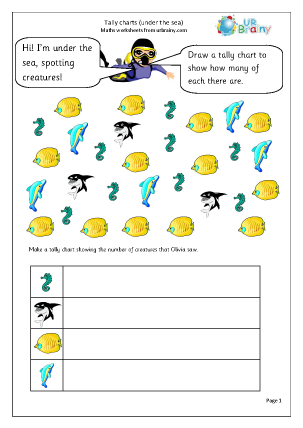
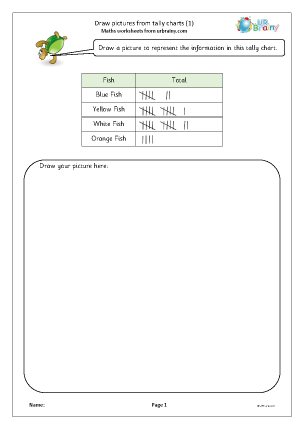
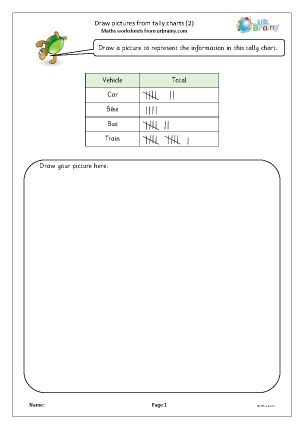
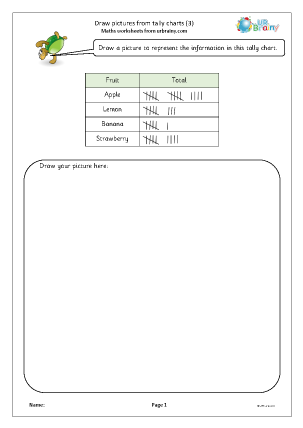
Tally charts
Interpret and create simple tally charts.


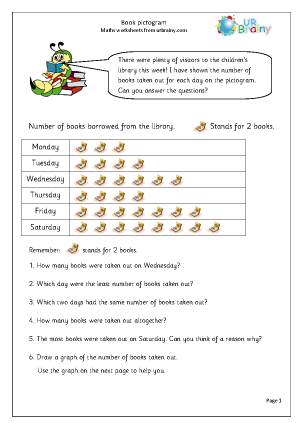
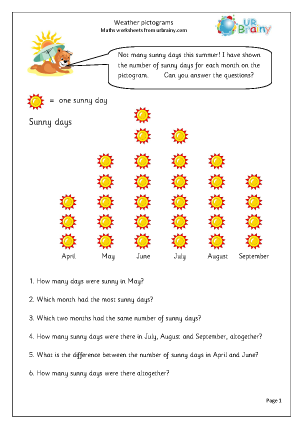
Pictograms
Interpret and draw pictograms.


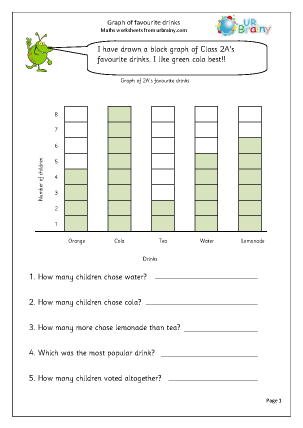
Block diagrams
Interpreting and drawing block diagrams.